Bitcoin Days Destroyed: Difference between revisions
Jump to navigation
Jump to search
distinguish percent-based measures from raw |
Add chart from BlockChain.info for BDD > 1 year old. |
||
| Line 20: | Line 20: | ||
* [http://abe.john-edwin-tobey.org/chain/Bitcoin?count=2016 Percent BitcoinDays Destroyed Metric - Previous 2016 blocks] | * [http://abe.john-edwin-tobey.org/chain/Bitcoin?count=2016 Percent BitcoinDays Destroyed Metric - Previous 2016 blocks] | ||
* [http://banana.mine.nu/daysdest.html Real-time BitcoinDays Destroyed Chart] | * [http://banana.mine.nu/daysdest.html Real-time BitcoinDays Destroyed Chart] | ||
* [http://blockchain.info/charts/bitcoin-days-destroyed-min-year BitcoinDays (of coins 1 year and older) Destroyed] | |||
==References== | ==References== | ||
Revision as of 01:39, 16 February 2012
Bitcoin Days Destroyed is a measure of the transaction volume of Bitcoin. [1] A bounty for a script to compute the Bitcoin Days Destroyed by the transactions in a block has been awarded. [2] Abe is a block chain browser that computes this statistic in real time.
Calculation
Example
If someone has 100BTC that they received a week ago and they spend it then 700 bitcoin days have been destroyed. If they take those 100BTC and send them to several addresses and then spend them then although the total transaction volume could be arbitrarily large the number of bitcoindays destroyed is still 700.
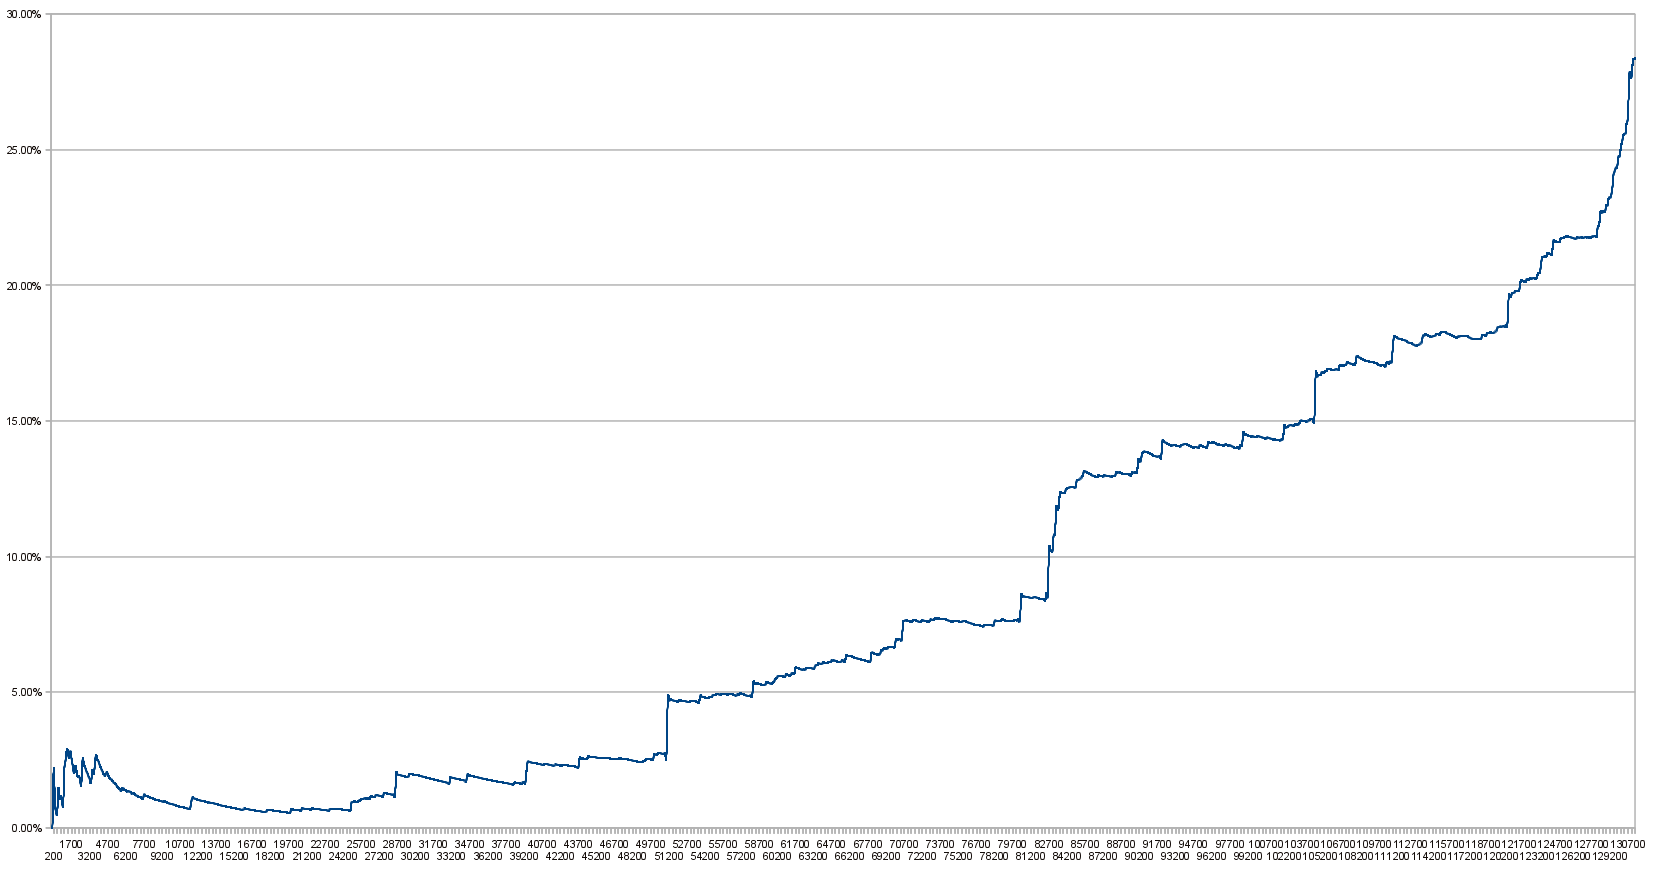
Graph of Percentage of Bitcoin Days Destroyed
Percentage of Bitcoin Days destroyed vs block number, as of June 17th 2011.

See Also
- Abe Alternate Block Explorer
External Links
- Percent BitcoinDays Destroyed Metric - Previous 2016 blocks
- Real-time BitcoinDays Destroyed Chart
- BitcoinDays (of coins 1 year and older) Destroyed