Distribution of nonces and hashes
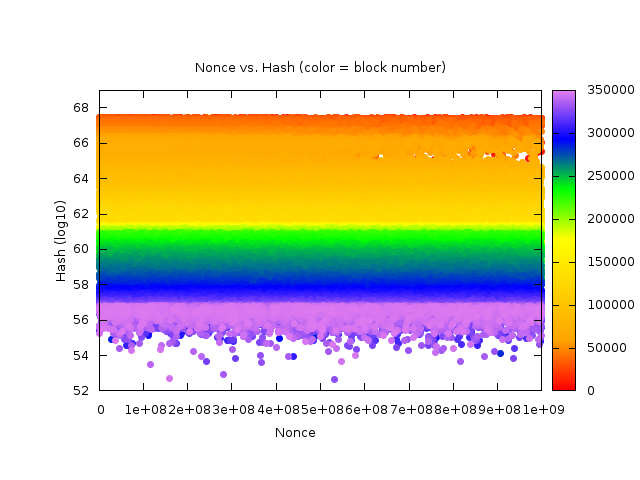
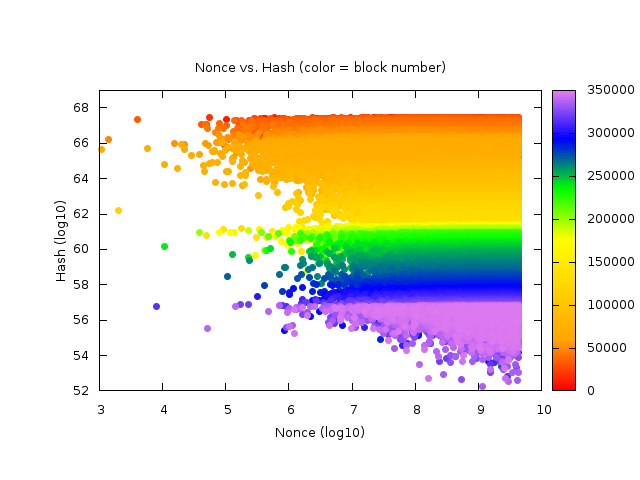
Nonce values vs. hashes for all the valid blocks in the blockchain:[1]
Nonces vs Hashes (y-axis logarithmic, x-axis linear)
This plot readily shows that the distribution of nonces that produce valid hashes is uniform.
Nonces vs Hashes (log-log scale)
In the animated version of this last plot,[2] you can really visualize the change in the difficulty and even see where the difficulty was decreased.
