File:Controlled supply-timeline estimation.png: Difference between revisions
Jump to navigation
Jump to search
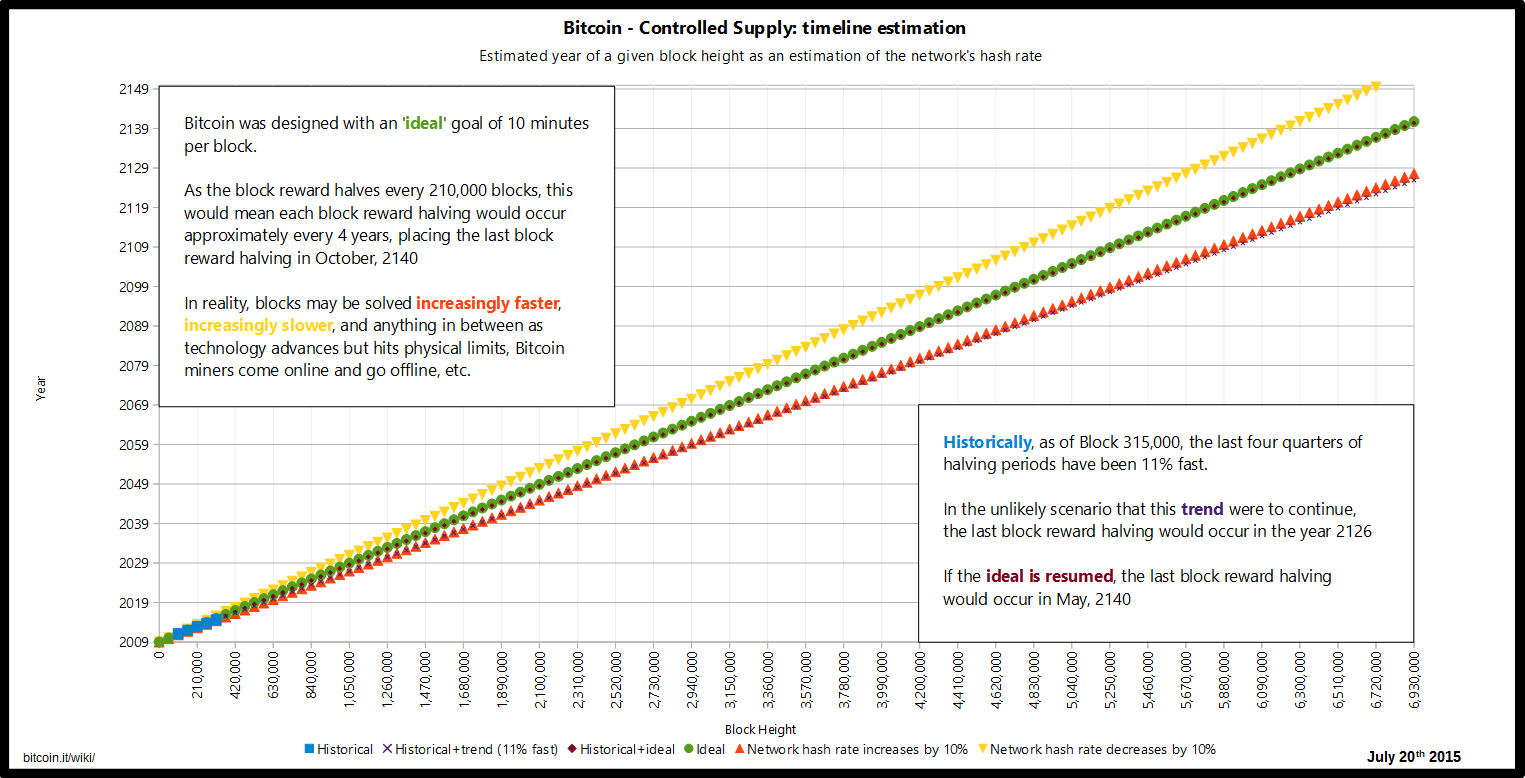
TheRealSteve (talk | contribs) Graph of Bitcoin's controlled supply as an estimate against time, depicting the influence of the network's hash rate (continuously faster vs continuously slower) om that timeline. This chart would benefit from a minimum periodical updating every 52,50... |
TheRealSteve (talk | contribs) TheRealSteve uploaded a new version of File:Controlled supply-timeline estimation.png |
(No difference)
| |
Revision as of 21:56, 30 July 2015
Graph of Bitcoin's controlled supply as an estimate against time, depicting the influence of the network's hash rate (continuously faster vs continuously slower) om that timeline.
This chart would benefit from a minimum periodical updating every 52,500 blocks (one quarter of a reward halving period) or approximately once every year. The next update opportunity is at block 367,500 estimated to occur around July 29th, 2015.
More frequent updates may be warranted if the network hash rate sees a sudden and sustained increase or decrease.
|
File history
Click on a date/time to view the file as it appeared at that time.
| Date/Time | Thumbnail | Dimensions | User | Comment | |
|---|---|---|---|---|---|
| current | 21:56, 30 July 2015 |  | 1,525 × 778 (130 KB) | TheRealSteve (talk | contribs) | Update for block 367,500 |
| 12:26, 20 July 2015 |  | 1,525 × 778 (130 KB) | TheRealSteve (talk | contribs) | Graph of Bitcoin's controlled supply as an estimate against time, depicting the influence of the network's hash rate (continuously faster vs continuously slower) om that timeline. This chart would benefit from a minimum periodical updating every 52,50... |
You cannot overwrite this file.
File usage
The following page uses this file: